
← All guides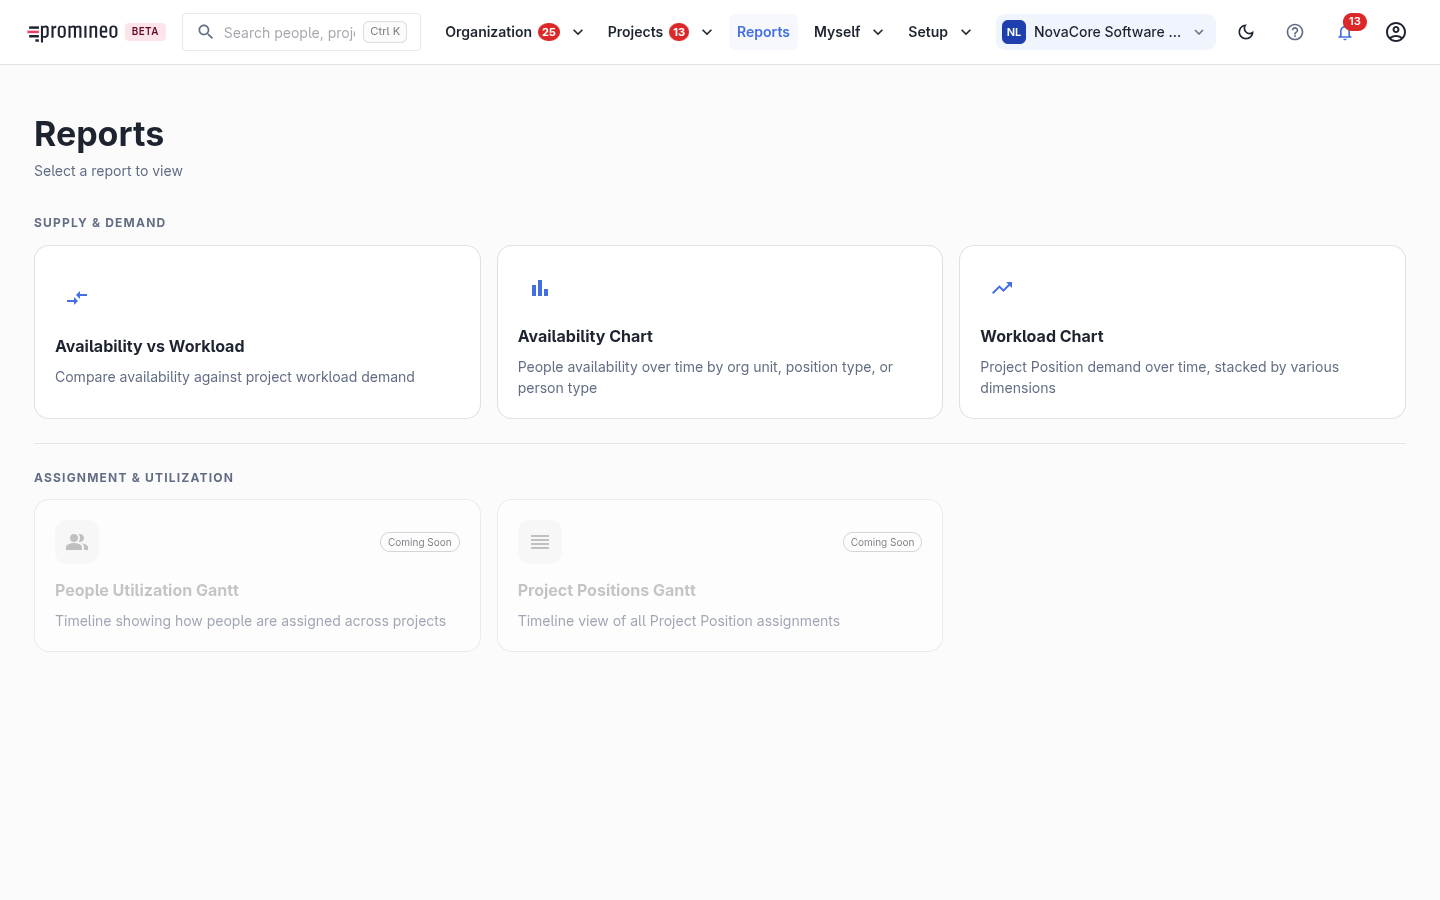
Reports
Organization-wide analysis of supply versus demand — pick a report to see how Availability and workload line up over time.
Organization-wide analysis of supply versus demand — pick a report to see how Availability and workload line up over time.
What you see
The Reports hub groups the available reports by theme. Under Supply & Demand:
- Availability vs Workload — total Availability against stacked project workload over time; the go-to view for spotting organization-wide gaps.
- Availability Chart — Availability over time, broken down by organization unit, Project Role, or person type.
- Workload Chart — Project Position demand over time, stacked by various dimensions.
An Assignment & Utilization section lists further reports (People Utilization Gantt, Project Positions Gantt) marked Coming Soon.
Why it matters
The landing pages answer "what needs attention right now"; Reports answer "what is the shape of supply and demand over the coming months, across the whole organization". Use them to spot a structural shortfall or surplus early and to feed staffing decisions — and, ultimately, a BI platform.