
People health
Everyone in your organization unit(s), ranked by the gap between what they are assigned and what they have available — so the people who need attention rise to the top.
Everyone in your organization unit(s), ranked by the gap between what they are assigned and what they have available — so the people who need attention rise to the top.
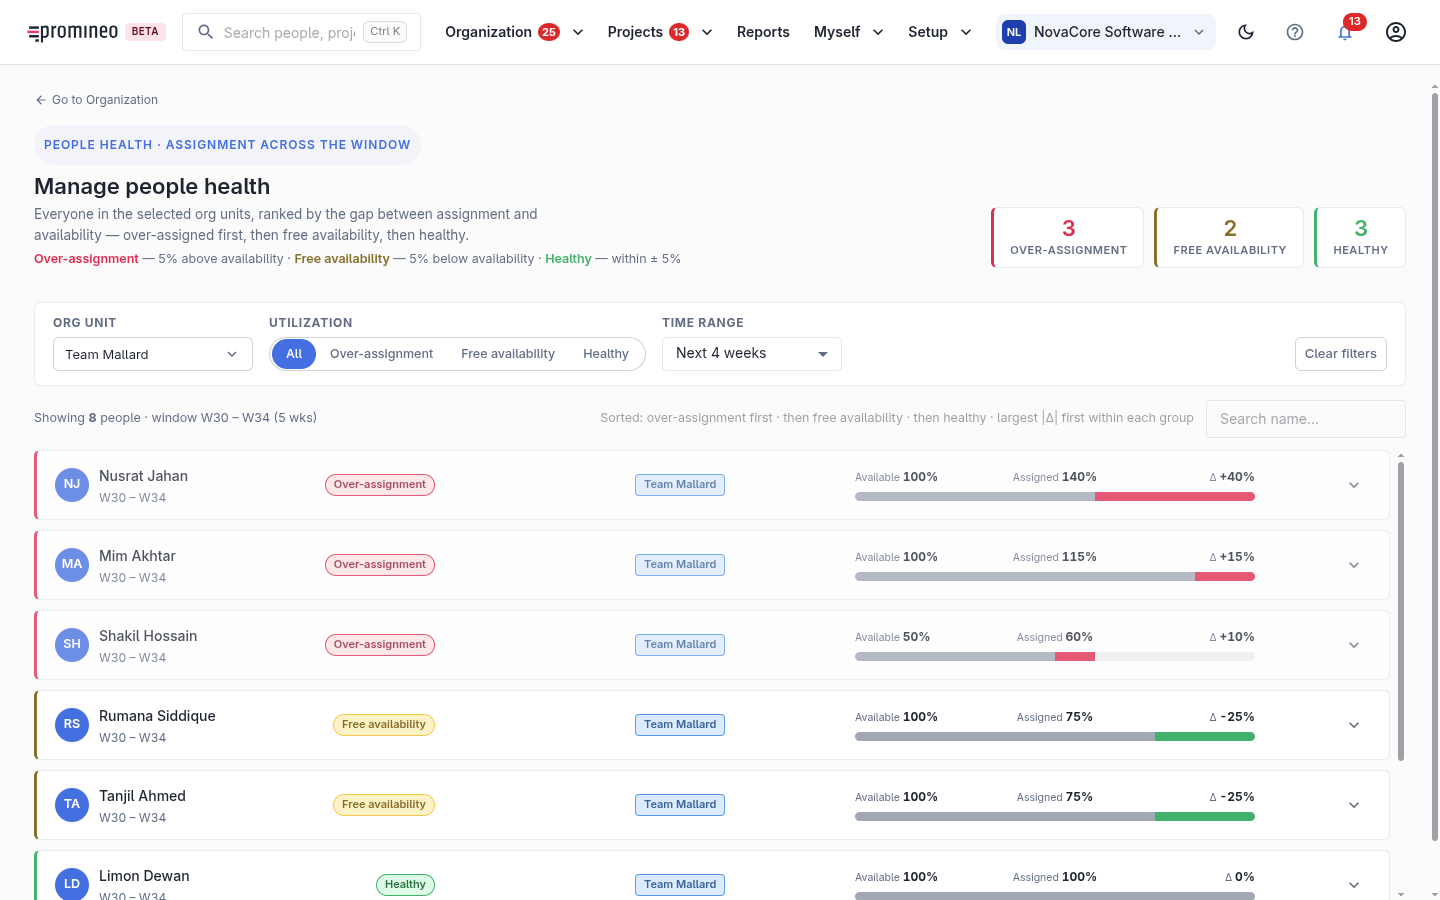
What you see
The list ranks people by their utilization gap: Over-assignment first, then Remaining availability, then healthy, with the largest gap first inside each group. The counters at the top summarize how many fall in each band. Filter by organization unit, by band (All / Over-assignment / Free availability / Healthy), and by time range, or search by name.
The bands are defined by how far assignment sits from Availability:
- Over-assignment — assigned roughly 5% or more above Availability.
- Free availability — assigned roughly 5% or more below Availability (spare capacity).
- Healthy — within about ±5%.
Reading a row
Each row shows the person, their organization unit, their Competence tags, and a bar comparing Available against Assigned with the delta (e.g. Available 100%, Assigned 140%, Δ +40%). Expand a row for the detail behind the number.
Why it matters, and what to do
This is where an organization manager acts on utilization. Someone in Over-assignment is at risk of overload and slipping deadlines; someone with lots of Remaining availability is spare capacity you could offer to a project. Use it alongside TBN positions: a person with free time here is a candidate to assign to an open request there.