
My overview
Your own workload at a glance: every project you're on, how much you're loaded over time, and whether you have spare time or too much.
Your own workload at a glance: every project you're on, how much you're loaded over time, and whether you have spare time or too much.
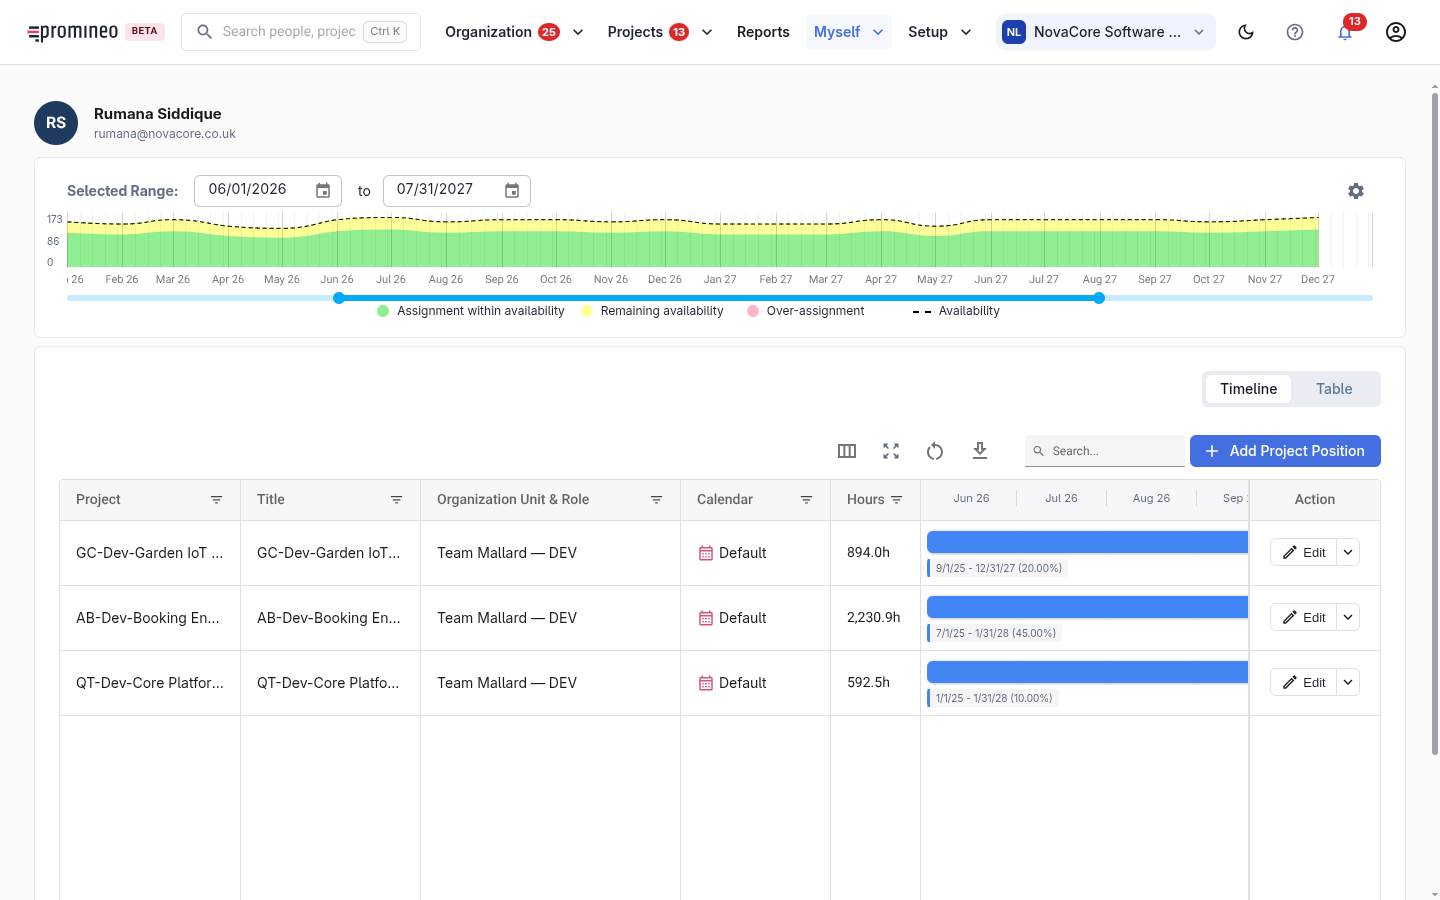
What you see
The chart across the top compares your total workload against your Availability over a date range you choose, with the excess called out as Over-assignment and the slack as Remaining availability. Below it, a grid lists every project and Project Position you're assigned to, with the load per period and a Gantt-style timeline. Toggle between Timeline and Table, and add a Project Position directly from here if you need to.
Reading the chart
The stacked areas separate Assignment within Availability (green), Remaining availability (yellow), and Over-assignment (pink), with your total Availability drawn as a dashed line. If pink appears you're booked beyond your capacity for that period; a lot of yellow means you have room for more.
Why it matters, and how to use it
Every employee has the same standing questions: do I have enough work short and long term, and is anyone expecting more of me than I can give? This screen answers both. If something looks wrong — a project you're not really on, or a load that's too high — that's a prompt to talk to your manager, and to check that your Work Calendar and Competence are correct.